
The NZDUSD pair grew 0.91% as of August 27, 2021, from the previous day’s close. It rose to a high of 0.7019, doubling up as the highest weekly gainer among major currency pairs at 2.71%.
Employment indicators
The New Zealand dollar (kiwi) surged against the US dollar (greenback) after an improvement in New Zealand’s employment indicators. Employment opportunities in all industries increased 0.8% to 17,273 jobs.
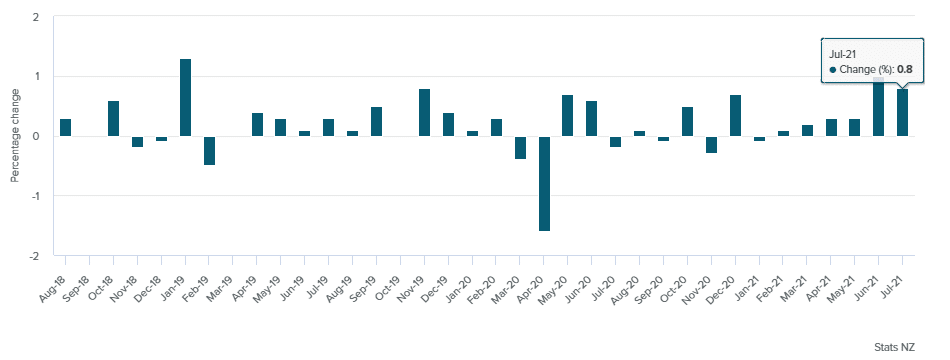
Service industries added 11,715 jobs in July 2021 (MoM), representing 0.7%, while goods producers increased their job opportunities by 1.3% or 5,631 jobs. However, primary industries inched lower at 1,094 jobs or 1.0%.
To facilitate the fight against Covid-19, the healthcare sector, as well as the social assistance industries, were the highest gainers adding 6.3% or 15,364 jobs. The construction industry followed next at 6.7%, representing an additional 12,097 jobs.
Investors took note that jobs in Auckland surged 2.9% or 21,221, while Waikato followed at 4.4% or 9,180 jobs. Among the five largest cities in NZ, the Bay of Plenty was the least gainer at 5.1% or 6,794 jobs in July 2021 (MoM).
The enactment of lockdown 2.0 in NZ had seen the city council of Wellington’s 1,800 employees work remotely (from home into August 2021). A total of 7,695 jobs were added in Wellington, representing a 3.1% rise from June 2021.
The release of building consents data on August 30, 2021, will affect the kiwi. It stood at 3.8% in July 2021. We expect business confidence data (for August 2021) by ANZ to affect the currency. It had dropped 3.8% in July 2021.
US economic recovery
The Bureau of Economic Analysis (BEA) reported that the US GDP rose 6.6% in the quarter ending June 2021 (QoQ). It rose from a previous record of 6.5% but fell short of the analysts’ estimates at 6.7%.
Corporate profits in the second quarter increased 9.7% from an earlier record of 4.5%.
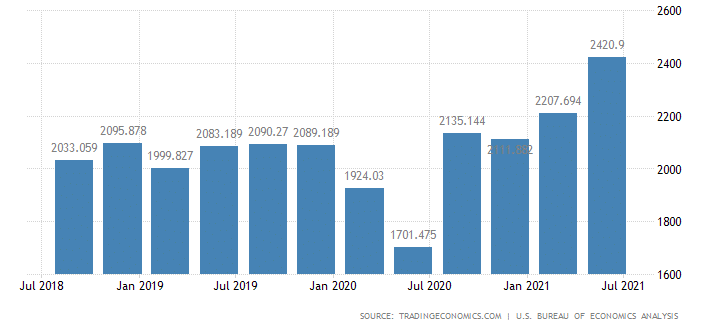
US corporate profits increased to an all-time high at $2.42 trillion in Q2 2021. It had risen 4.5% in Q1 2021 to $2.2207 trillion. There was a 19.2% increase in undistributed profits to $!.01 trillion.
Investment funds available to US companies also increased to $3.06 trillion, representing a surge of 7.2%. Net dividends also soared 3.7% to $1.41 trillion.
Improved company profits led to the decline of the 4-week average of US jobless claims from 378.0K to 366.50K. Additionally, prices of personal consumption expenditures (PCE) in the US also increased 6.5% in July 2021 from a previous record of 3.8%.
Higher PCE prices indicate an increase in product prices among US consumers. This surge shows stronger purchasing trends in tandem with the rising inflation.
Technical analysis
The NZDUSD formed a pullback from August 23, 2021. It has risen from its support level at 0.68792 to 0.69976, propelled by surging volatility. The 14-day ATR rose to 0.00776, showing increasing volatility.
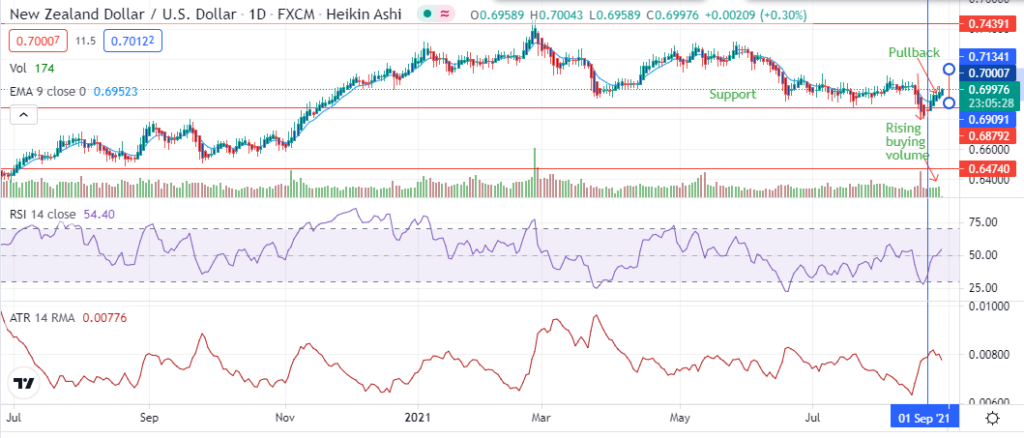
There is an increase in the buying momentum, with the 14-day RSI reaching 54.40. An uptrend above 0.71341 may push the price towards the resistance line at 0.74391.
Negative data such as the decline in New Zealand’s building consents can push prices lower to breach the support line at 0.68792. We expect a deeper correction towards 0.64740 after the breach.


 react to positive employment data ahead of the release of building consent and business confidence data? We look at the performance of the NZDUSD pair.)