Conducting technical analysis as part of one’s trading strategy is an integral part of forex trading, along with commodities and shares trading. It includes the study of various trading indicators, which can be described as mathematical calculations, plotted as lines on a price chart. These indicators allow traders to effectively identify trends and signals within the market.
In Forex, trading indicators thus form a large part of any technical trader’s strategy. Along with the right risk management tools, it helps traders gain more insight into different price trends in the market. This by no means indicates that technical indicators automatically lead traders into profit. Technical indicators are mainly used for saving time during market analysis and to find a trade idea. Some common forex indicators are used heavily in the forex market. Some of them are mentioned in brief below.
Relative Strength Index:
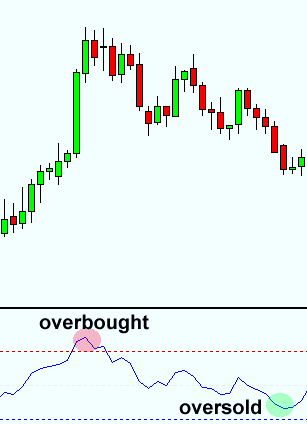
In the forex market, the RSI or relative strength index is an indicator used to identify market conditions, momentum and warning signals when dangerous price movements occur. It is generally expressed as a figure ranging between 0 and 100. As a rule of thumb, an asset which is near or at the 30 level is considered oversold, while an asset around the 70 level is considered overbought. An oversold signal may suggest that short term declines in a market are reaching maturity. As a result, the assets may be in for a rally. One the other hand, an overbought signal may suggest that short-term gains in the market are reaching a point of correction. The assets thus may be in for a price correction.
Moving Average:
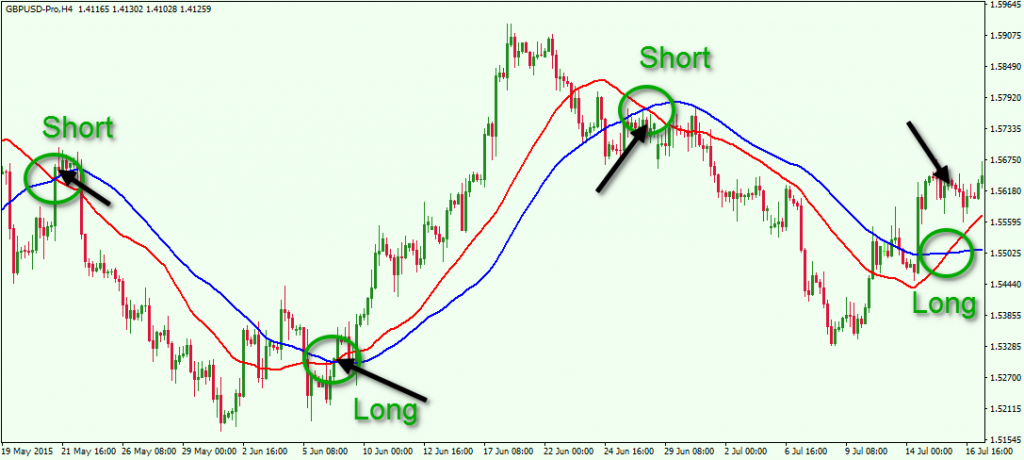
Moving average or MA is a trend indicator used in the forex market to identify and follow a trend. It shows an average value of price, over any given time. When applying a moving average on a graph, it always follows the price. The MA line helps get rid of the so-called unwanted price “noise”, by smoothening the price volatility. This helps traders focus on the main trend and not on the corrections. It should be noted that the MA only outlines the current direction of the market and cannot predict the future price.
There are four main types of moving averages used in the forex market. They are simple, linear weighted, smoothed, exponential. They differ from each other by the weight assigned to the latest data in each case.
Bollinger Bands:
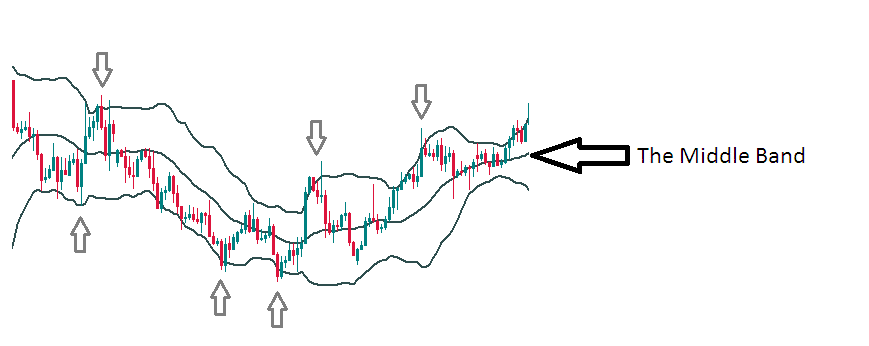
Bollinger Bands are a popularly used forex indicator, used mainly to measure the volatility of the market, or in other words, the degree of variation of trading price. They usually consist of three lines, with each line or band being a moving average. The middle line generally represents a 20 period simple moving average. The upper and lower lines which are called volatility bands are calculated by the shift of two standard deviations above and below the middle line.
When using Bollinger bands, it should be noted that the price constantly revolves around the middle line and is boxed between the two outside lines. After any price deviation from the centre, the price is forced to return back to the middle. Bollinger bands either come closer together or they spread far away from each, widening the gap. The volatility of the market is set to be lower if the range if narrow, and becomes more volatile as the bands or lines widen.
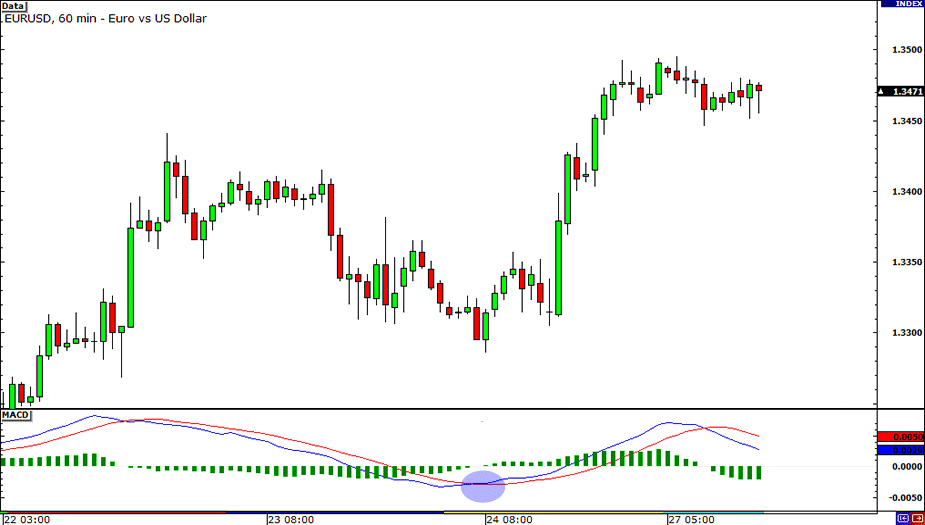
Moving Average Convergence/Divergence:
Moving Average Convergence/Divergence, popularly known as MACD, is a kind of oscillator and technical indicator. It is usually used for measuring the driving force behind a market. The MACD is based both on moving averages as well as some additional formulas. As an oscillator, it is usually seen in separate boxes below the normal price chart. It has to turn back down after rising to higher levels, along with the price chart.
Thus, in other words, the MACD helps in detecting changes in momentum. This is done by comparing the two moving averages, helping traders to identify possible buy and sell opportunities. These are usually identified around various support and resistance levels. Momentum is said to be decreasing when the moving averages converge from each other and increasing when the moving averages diverge from each other.
Final Thoughts
Technical indicators are powerful tools used by skilled and experienced traders when making well-informed decisions in the forex market. It should be noted that each indicator has its own sets of advantages and disadvantages. Relying totally on any single indicator is not a wise choice when trading in the forex market. It is instead advised for traders to use a combination of several indicators simultaneously to take better trading decisions. On the other hand, traders are also not advised to focus on too many indicators at a time, using only those indicators that suit the trader’s style and preference.


