
In technical analysis, traders rely on an array of indicators to get insights on the direction price is likely to move. While the cryptocurrency and forex markets differ greatly, there are tools that can be used to predict price actions in the two markets.
TradingView is one of the largest platforms for technical analysis is also home to some of the commonly used indicators. Below are some of the best tools used by market participants to study price action in forex and crypto markets.
Moving Average Convergence/Divergence
Arguably the most popular TradingView indicator in cryptocurrency and forex technical analysis. It stands out partly because it provides strong trading signals while dealing with highly volatile assets.
Considering how volatile cryptocurrencies and major currency pairs can be, it is important to rely on a tool that can shun market noise and provide insight into the prevailing trend. Whether dealing with short-term price or long-term price momentum, the MACD does an excellent job determining the market direction and where the prices are likely to turn.
The use of the Exponential Moving Average in the tool improves sensitivity to trend changes. It also enhances the determination of price momentum.
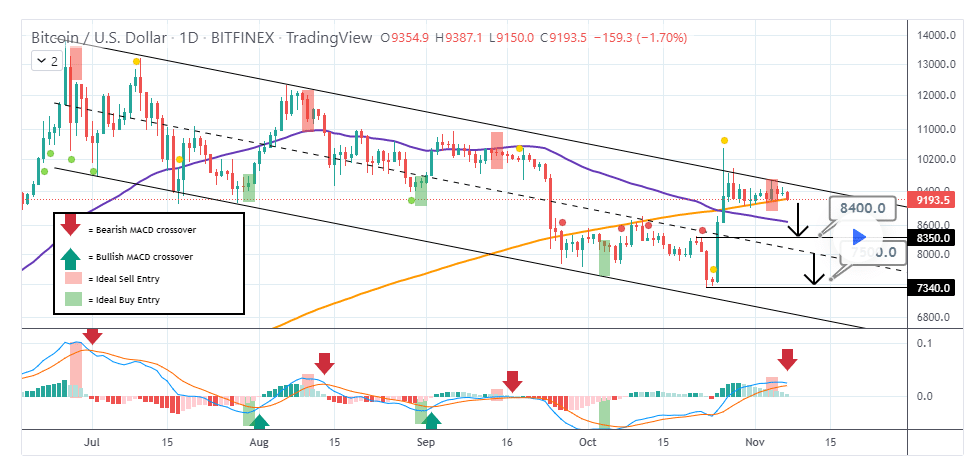
Whenever the MACD line crosses and moves above the signal line, it implies the market has turned bullish and that price is likely to continue moving up. If MACD and signal line rises simultaneously, it means strong upward momentum, which is further affirmed by the expansion of the histogram.
Similarly, whenever the MACD line crosses the signal line and starts moving lower, it implies a buildup in selling pressure. The move lower of MACD and signal line affirms increasing selling pressure signaling that the cryptocurrency or currency pair will likely continue tanking.
Whenever there is a divergence between the MACD and price, the prospect of price reversing direction is usually high. For instance, if the price continues to move up, making higher highs as the MACD moves down, making lower lows, it might be wise to be wary of potential price reversal.
Should the MACD line cross the signal line and then enter the negative territory, the same implies a buildup in bearish pressure in the market. In most cases, the price tends to reverse and start edging lower after making the higher highs on a buildup in selling pressure.
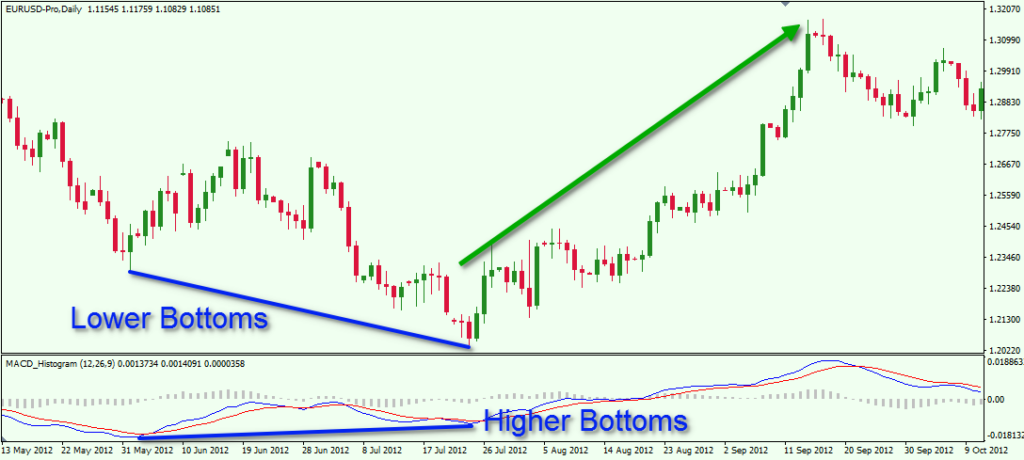
Likewise, should the price of a cryptocurrency pair or currency pair make lower lows as the MACD line moves up crossing the signal line, the odds of price reversal are usually high. The MACD and the signal line moving into the positive territory accompanied by the histogram expanding underscores a buildup in buying pressure.
Conversely, the prospect of price reversing from making lower lows to edging higher is usually high given the buildup in buying pressure.
The Relative Strength Index
It is a common TradingView momentum indicator ideal for analyzing asset prices during periods of wild swings. The tool can signal whether a price has moved too far from the mean value, signaling a potential reversal.
Cryptocurrencies are some of the most volatile assets that can post double-digit gains in a matter of minutes. While major currencies tend to be stable, the same cannot be said about exotic pairs or during events of significant impact in the broader forex market.
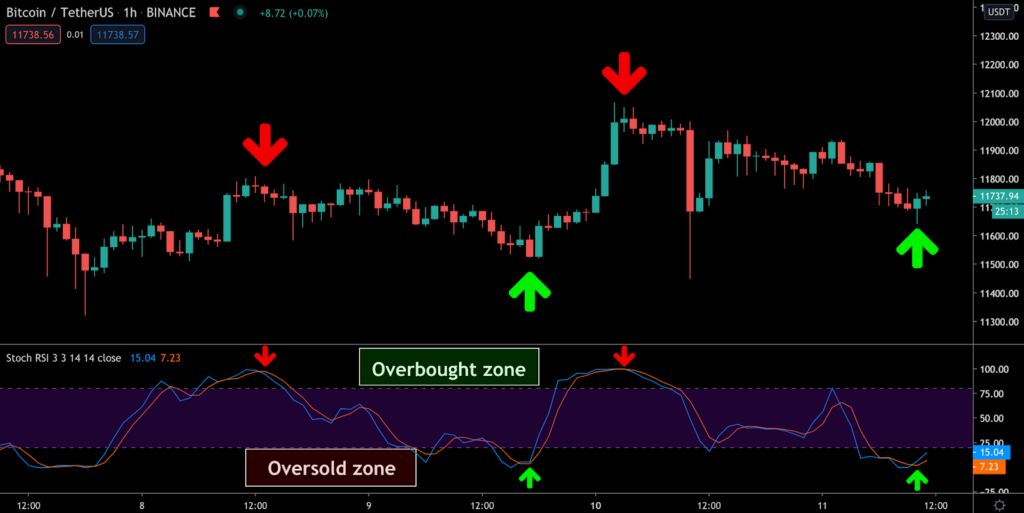
The tool comes with readings of between 0 and 100. Whenever the RSI reading is above 70, the underlying asset price is considered overbought. In this case, technical analysts watch out for potential reversals as the overbought condition signals price has moved up significantly from the real value.
Likewise, when the RSI reading is below 30, it implies the market is oversold. Technical analysts take note of these conditions and look out for potential reversals as in most cases; price tends to reverse and start moving up after moving lower significantly.
Just like the MACD, RSI is another important tool for observing periods of divergence in the market. For instance, whenever a cryptocurrency price is moving up, making higher highs but the RSI is moving down, making lower lows, caution is of the most importance.
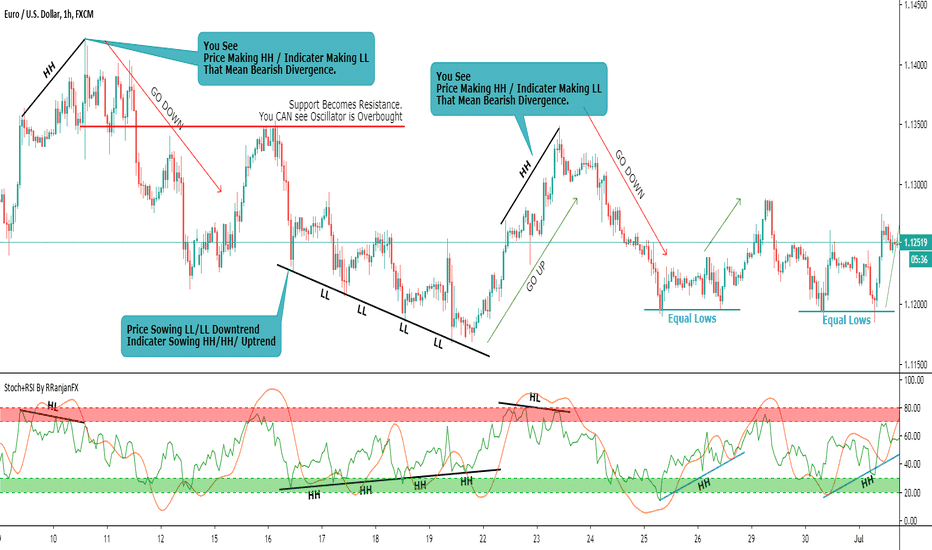
The RSI moving lower to the extent of crossing the 50 level and moving lower affirms a buildup in selling pressure in the market. Similarly, price reversing from higher highs and edging lower is usually high.
Likewise, it is important to be extremely cautious whenever the RSI is moving up, making higher highs even as the price moves up, making lower lows. The prospect of price reversing from the downtrend and starting to move up in line with the RSI is usually high, given the buildup in buying pressure.
Stochastic is another momentum indicator that operates the same way as the RSI. However, the tool signals overbought conditions whenever its reading is above 80 instead of 70 for the RSI. It also signals oversold conditions when the reading is below 20 instead of 30 for the RSI.
While using the RSI and Stochastic indicators to ascertain if a cryptocurrency or currency pair has momentum, it is important to note that they can remain in an overbought or oversold condition for a while.
Just because the RSI reading has hit the 70 mark or 80 for the stochastic, implying overbought does not mean that price will automatically reverse and start moving lower. Depending on the strength of the upward momentum, it might remain in the overbought condition for quite some time before a reversal occurs.
Final thoughts
While using the MACD and the RSI for cryptocurrency and forex trading analysis, it is important to note that they don’t provide accurate signals all the time. Given that the indicators depend on historical data to try and predict future means, they can provide false signals depending on the prevailing events. In addition, no one tool should be used in isolation to make a trading decision. Combining the RSI and the MACD can improve the prospects of generating a much more reliable trading signal.


