Cryptocurrencies, like most financial assets, are speculative assets. This means that the only way to profit from their trade is to try to predict their future price action accurately. Traders and analysts the world over have been developing tools to help analyze and forecast the prices of these digital assets. These analytical methods are generally divided into technical and fundamental analyses. The former attempts to establish price patterns with the assumption that history repeats itself. Fundamental analysis, on the other hand, takes a big-picture approach to valuing cryptocurrencies.
About fundamental analysis
Fundamental analysts operate with the main aim of establishing a cryptocurrency’s intrinsic value. They do this by looking at all the available financial information about the crypto asset in question. This could be such things as its use cases, the number of users, or the team behind the project. Basically, they aim to establish where the coin derives its value from.
However, the crypto market is unique, and traditional fundamental indicators seldom work on this new asset class. Therefore, we shall look at indicators specially formulated for this market, as well as the insights they provide.
The fear and greed index
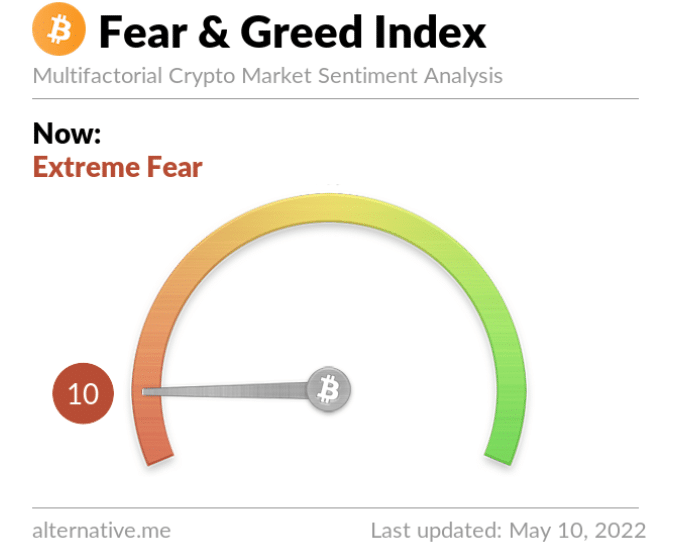
This is an index that attempts to measure the sentiment surrounding Bitcoin, the largest and most popular cryptocurrency. It reads from 0 to 100. The lower end of the spectrum represents fear in the market, while the higher end shows increasing greed.
When the index reads anywhere between 0 to 24, the market is defined as being in extreme fear. 25 to 49 is read as fear, while 50 is neutral. 51 to 74 points to greed in the market, while anything over 75 is read as extreme greed.
When the market is in extreme fear, most people shy away from buying the crypto asset, while others rush to sell their holdings. This drives down its prices, providing a unique opportunity of buying the dip. When the index reads extreme greed, people are buying into the coin largely due to FOMO, and a crash may be imminent. This presents prudent investors with an opportunity to sell high.
How is this index calculated? Well, it is a collection of various components. These are BTC’s volatility, the market volume/momentum, social media interactions, Bitcoin dominance, and Google trend data.
Bitcoin dominance
This is a metric that measures the market cap of Bitcoin against that of the rest of the crypto market and expresses it as a ratio. In the early 2010s, Bitcoin was the largest crypto among a few other players in the market. Its dominance was close to 100%. Nowadays, with altcoins launching left, right, and center, BTC’s dominance is much reduced, but the metric is still very much useful to traders.
For instance, when the price of Bitcoin rises while its dominance also rallies, it points to a bull market for BTC. This would be a good time to buy the coin. However, if its price falls while its dominance rises, it points to a bear market for altcoins. Alternatively, if BTC is rallying, but its dominance is trending down, then altcoins are in a bull market. If both the price and dominance of BTC fall, then it’s a bear market all across the board.
Correlation to Bitcoin
Correlation is a mathematical measure that quantifies the relationship between two statistical variables. The correlation to the Bitcoin indicator measures the relationship between an altcoin’s price with that of BTC. Its scale reads from -1 to 1.
A reading close to -1 indicates that the price movement of the altcoin in question is inversely proportional to BTC’s price. In simpler terms, the prices of the two coins tend to move in opposite directions. A score of 1 means that the prices of both coins move in tandem. A reading of 0 or near zero suggests that the price movements of both coins have little to no relationship.
In your portfolio, you should aim to have a collection of assets with low correlation. This way, poor performance by any one coin does not drastically affect your whole portfolio.
Supply concentration
This is a metric that shows the distribution of a crypto asset’s circulating supply. In this way, it speaks to the decentralization of the asset. If an asset has a high supply concentration, then most of its volume will be in the hands of whales and/or investors. However, if most of its volume is held by retail traders, then it is said to have a low supply concentration. Typically, you’ll want to invest in a coin with low supply concentration, as this means a few addresses cannot conspire to manipulate its price significantly.
To clarify, a whale is any address that holds more than 1% of an asset’s total circulating supply. An investor address holds between 0.1% to 1% of this supply, while a retail address holds less than 0.1%.
Network value to transactions ratio (NVT)
This is a metric obtained by dividing a coin’s market cap by its daily transaction volume. It works under the assumption that the more daily transaction volume a coin displays, the more its value (and adoption). Therefore, if the coin’s market cap increases but there is no commensurate increase in its daily transactions, then the coin may be in a bubble. This usually manifests as a high NVT ratio, oftentimes above 90.
Conversely, if its market value stagnates while the daily transaction volume increases, then the coin may be undervalued. This presents a unique buying opportunity. Therefore, investors will be looking for a decreasing NVT ratio to buy into a coin.
Conclusion
Cryptocurrencies, like all other speculative assets, call for a fair amount of analysis in order to successfully predict their price movements. To that end, there are two analysis types – technical and fundamental. While crypto technical analysis resembles that of traditional markets, its fundamental analysis is inherently different from those of other markets. We have discussed some popular fundamental indicators, but this list is far from exhaustive. Be that as it may, any one or a combination of these indicators will prove especially helpful for your crypto trades.


