
- AUD/CAD buyers are in an upward structure resulting in the decline of pair sellers.
- Fall in prices of AUD is more likely to show a bearish run to the USD performance.
The Australian dollar rose against the Canadian dollar as it recorded another high price in March. The prices of 0.9999 were recorded, which made it clear the resistance prices of 0.9930 in 2018. However, it suffered a plunge towards the end of the month. It withdrew and rested at 0.9786, as viewed on the W1 time frame.
AUD performance against the USD aroused the interest of this pair. The resistance of 0.9897 might change anytime soon. When it changes, a fall in prices is more likely; therefore, the outlook is bearish.
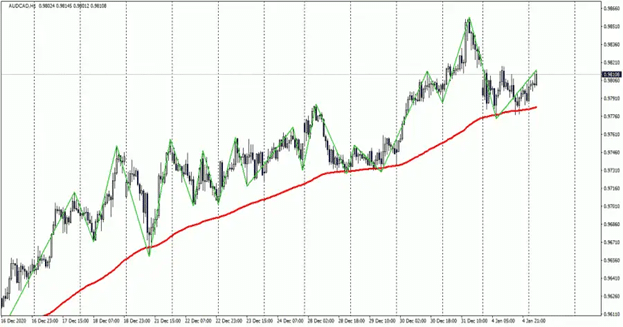
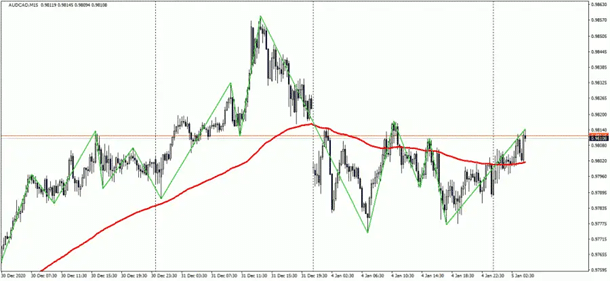
The AUD/CAD pair is currently trading in an upward trend. The price is above the moving average, which indicates the strength of bulls. The zigzag indicator also shows the priority of the bullish direction as significant highs and lows are increasing.
As for intraday trading, the simplest way to make a profit is to think about long positions. Purchases are often opened at the level of 0.9590 to reach the primary target level of 0.9630. The second target is seen at 0.9670.
Stop-loss can take place at the extent of 0.9560. It’ll be possible to sell the pair once the price breaks through the level of 0.9530 and consolidates below it. The loss order can be placed at 0.9560, while the take profit order is at the 0.9490 level.
To confirm the opportunity to open long positions, take a look at the M15 chart, which shows the pair’s continued upward movement.
Daily chart
In this timeframe, you can make purchases once the value reaches the level of 0.9709 and higher. For selling, it can be placed when the price reaches the level of 0.9244 and below.
Four-hour chart (H4)
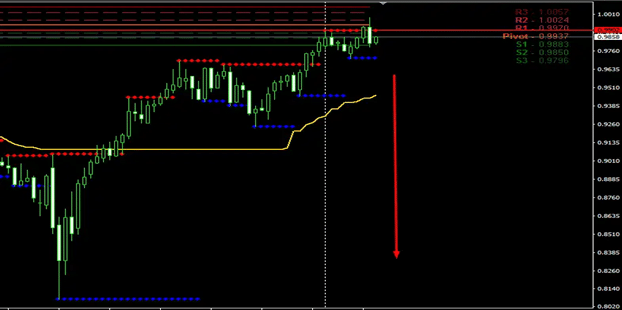
When the price reaches the level of 0.9709 and higher, a purchase order can be created. However, selling can be done when the price reaches the level of 0.9454 and below.
The series of bearish candles doesn’t stop at the H4, and the downtrend drifts further down. The downward price movement does not stop in this case. Only the short prevails in the current situation process by the drifting of the MACD generator bar graph into negative territory. In the Fibo correctional grid, which is indicated by the level of 0.9818, the price is predicted to approach 100.0.
Hourly chart (H1)
On the H1 chart, purchases are made once the price reaches the level of 0.9709 and higher. This chart shows that selling can be done once the price reaches the level of 0.9583 and below.
Based on the hourly chart, the buyers are stronger than the sellers in the AUB/CAB pair. The moving average has a 120 period located below the price. AUD/CAD also shows a short directional movement, which means that it’s better to consider selling in priority. An upward structure is indicated by a zigzag as the lows and highs go up.
According to the M15 chart, purchases also prevail, so it’s best to buy a pair to identify the sell signal. The Accelerator oscillator tells the possibility of opening a trade. Traders can buy once the indicator signals growth and sell when it signals a decline.
Think about selling from the level of 0.9640 with the first target of profit to the price level of 0.9600. The second target at 0.9560, stop loss at the level of 0.9670. When the pair is mounted at the 0.9700 price level, consider buying. Take profit for purchases at the level of 0.9740 and stop-loss at the level of 0.9670. M15 is often considered signal confirmation.


