
In the Forex market, it is essential to know about the nature of the price wave, e.g., whether it has reached its end or is a mere reiteration in the bigger trend. In this regard, you can save your money for more advantageous situations and stay clear of false signals by using more than one source to confirm the trend.
Here, we shall talk about a strategy involving two indicators that are vastly different from each other, namely PSAR and ADX. Let us look at both of them at individual levels first and then determine how we can conduct trades using them.
The ADX (Average Directional Movement Index)
ADX is a technical indicator using which you can find out how strong a trend is. Although you can use it independently, in order to understand it, you have to know what a DMI indicator is. This consists of two lines, namely Plus DI and Minus DI.
When the former crosses above the latter, the position is said to be long, and when the opposite occurs, the position is said to be short. However, frequent and sudden changes in the price direction may occur if only Plus DI and Minus DI lines are used. In order to negate this, we can use it in combination with ADX.
ADX interprets the price action precisely in the following ways:
- It indicates the presence of a trend and tells you whether it is late or early.
- It gives an early indication of a trend reversal.
- The direction, nevertheless, cannot be known with the help of ADX.
PSAR (Parabolic SAR)
Using the Parabolic SAR indicator, you can follow the dots in a trend up to the point where a reversal occurs. This indicator is mostly used for stop placement rather than assessing in which direction the trend is moving.
We can interpret PSAR in the following way:
- During an uptrend, make a purchase when the SAR advances downwards beneath the price. You may consider this as the stop level lying beneath the current cost, and it will proceed upwards with each passing day up to the point when the price sinks to the stop level.
- During a downtrend, get rid of your position when the SAR goes down under the price. This stop level will advance downward with each passing day prior to the price rising to the stop level.
The rationale behind this is that with the rising price, the dots shall also move upwards, albeit at a snail’s pace, in the beginning, gaining speed with time. By the time the dots almost reach the price action, the speed of the SAR is considerable. Thus, the stop level gets activated, indicating the traders to get out of the long position.
Combining the two indicators
As we can see, in a market with a pronounced trend, PSAR is a great indicator for a trader, providing them with robust trading signals. When the trend increases in strength, the distance between the prices and the Parabolic diminishes, which is favorable for us.
Hence, when the PSAR lies near the prices and the pivot point ADX setup gets formed, you have all you need to make a great trade. The smallest countertrend movement at this point would go beyond the Parabolic and indicate a chance to make an entry into the market.
This indicator will generally arrive prior to the decline of the ADX. If you want a pattern that can signal a vital trend reversal, then this is ideal for you. PSAR can also be used to find out a position’s exit point. With the PSAR turns over to the other side, it is a good time to make an exit.
Entry and exit rules
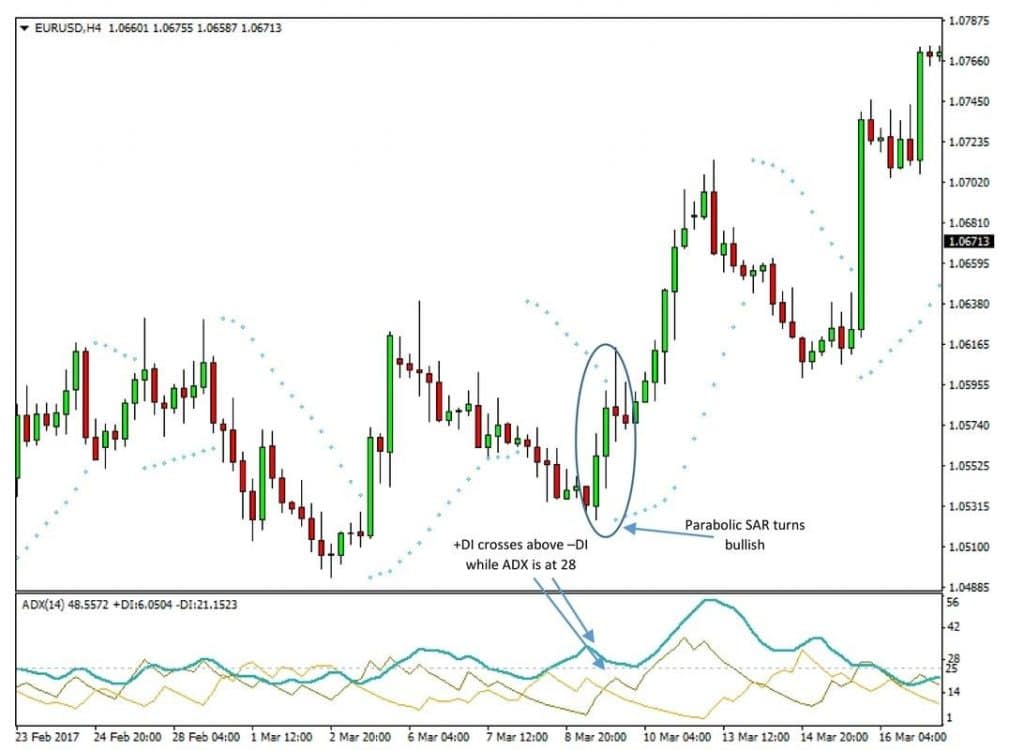
It is time to make a long entry when:
- ADX lies at a value greater than 25.
- Plus DI intersects minus DI and moves upwards.
- The bullish signal appears due to the reversal of Parabolic SAR.
A short entry is advisable when:
- ADX lies at a value greater than 25.
- Plus DI intersects minus DI and moves downwards.
- The bearish signal appears due to the reversal of Parabolic SAR.
You should consider making an exit when the plus DI and minus DI lines intersect once more.
Placing stop loss
PSAR can be used for initial stop placement and additionally for trailing the stop with the progress of trade. Provided the main trade criteria are not endangered according to ADX indication, a principal resistance or support level can act as a stop-loss.
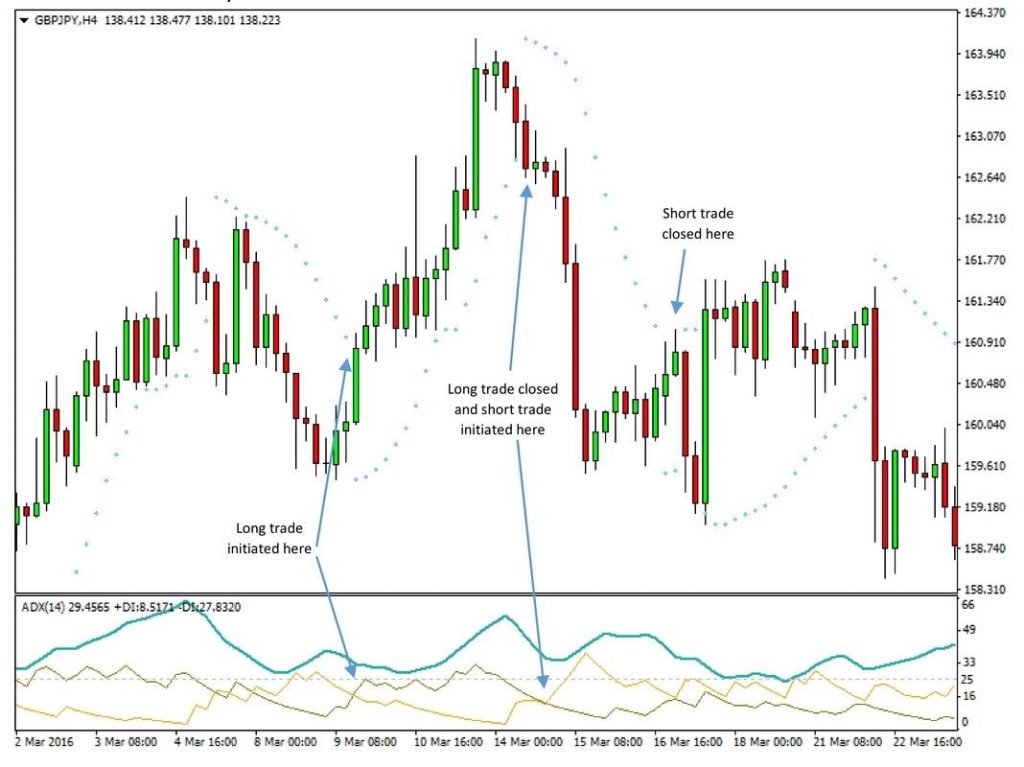
Among the main advantages of ADX and the trading strategy based on it is that huge gains can be made in two directions through the reversal of position when a drastic trend reversal occurs in the market. This phenomenon is depicted in the above chart.
Managing the open trade
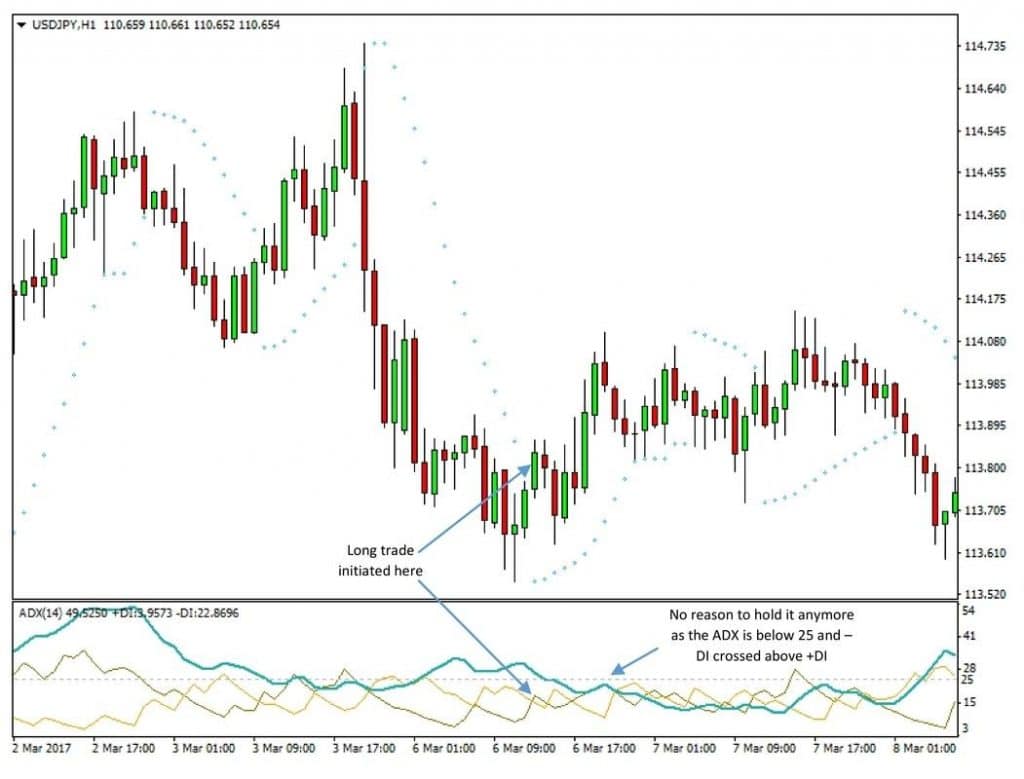
The general rule is to continue the trade up to the point when the Parabolic trailing stop is removed. You should keep the trade going, notwithstanding the minor shifts in DI and ADX line positions. Nevertheless, if the value of ADX lies beneath 25 and the DI lines undergo a reversal in the opposite direction, as shown in the chart above, you should close the position manually.
Pros and cons
The advantage of this strategy is that you can filter an entry and foresee a good time to make an exit. The downside is that although ADX and PSAR work very well together, the former is a weak link because it can show a particular signal during a trade and switch to another later on.
Recap
Thus, we saw how you can combine PSAR and ADX to make a good entry and exit in your trade, place stop-losses, and manage the open trade. You would do well to remember waiting for the current price bar closure after getting the indication from ADX to avoid being misled.


